UX for Big Data
What is Big Data?
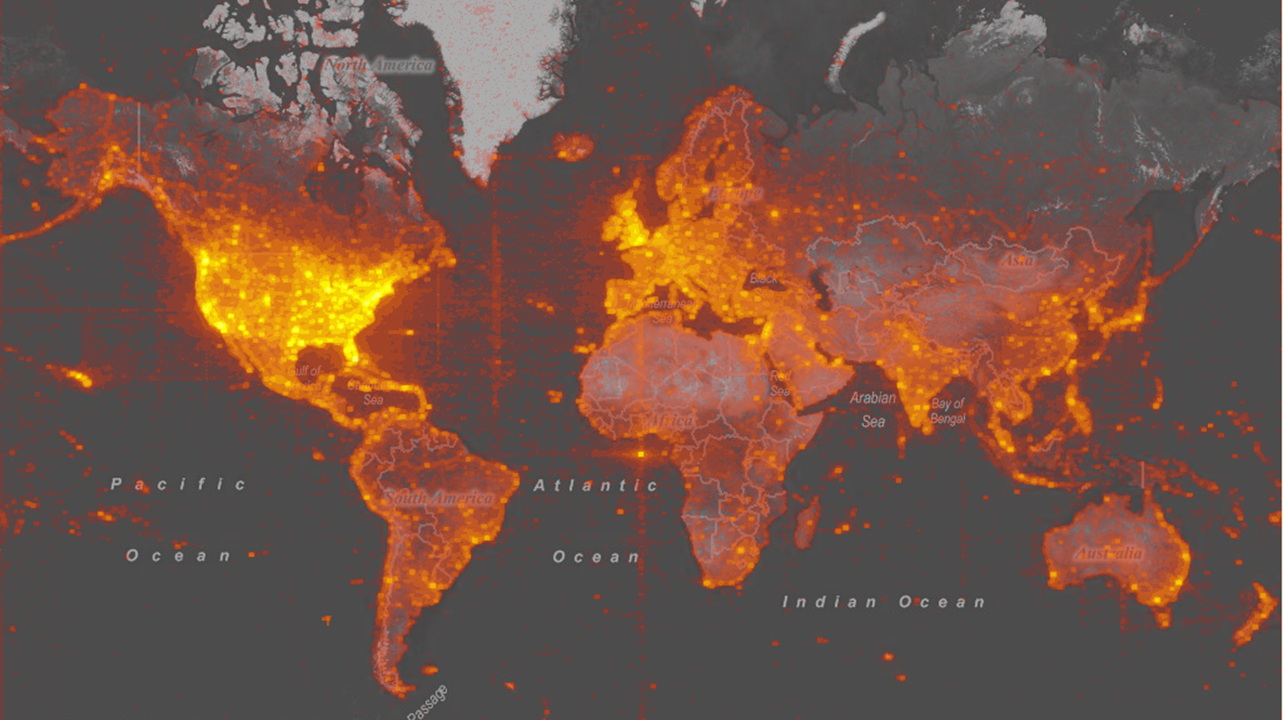
Lots of different definitions can be found for "big data," but they all have one aspect in common: big data is inconvenient. It's too big to fit on screen, or in memory, or on disk. There are more fields than are easy to articulate. And it is so ill-organized and messy that it will take a fair bit of nursing to get it into usable shape.
How is it different?
Big data requires both rethinking the front-end and the back-end. Slow database queries mean that users cannot take advantage of the massive speeds of a big database; the wrong visual presentations means that visual clutter overwhelms the data.
Back-End Solutions
These challenges are about tradeoffs.
Indexes and pre-aggregated data get precision, at the cost of flexibility. Approximations gain flexibility, but lose precision. Distributed systems can keep both, at the cost of reliability
Each of these calls for new visual representations.
Front-End Approaches
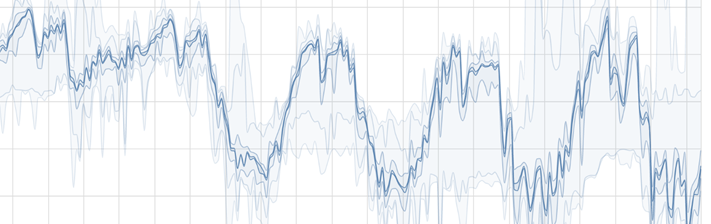
A big-data scatterplot can turn into a formless blob; a big-data line chart can become an overlapping crowd. An approximate query should have its imprecision reflected in the user interface.
We can choose points in the data space to address these ideas.
This talk from the OpenVis Conference 2015, Boston, provides an overview of my approach.
Get involved
This is an exciting conversation, and a huge opportunity for researchers from the human-computer interaction (HCI), database, and data visualization communities.
Some of the places this has been discussed:
- DSIA (Data Systems for Interactive Visualization) workshops at IEEE VIS 2015-2019
- LDAV (Large Data Analysis and Visualization) workshops at IEEE VIS (ongoing)
- HILDA (Human-in-the-Loop Data Analytics) at ACM SIGMOD (ongoing).
We also focused on this topic at two different Dagstuhl workshops
- 2017: Connecting Visualization and Data Management Research
- 2018: Progressive Data Analysis and Visualization
Dive Deeper
These papers explore some of the technical challenges around big data analytics.
Overview of Challenges
- Fisher, D. DeLine, R., Czerwinski, M., Drucker, S. "Interactions with Big Data Analytics." Interactions vol 19 no. 3. pp 50-59. May 2012. https://doi.org/10.1145/2168931.2168943
- Fisher, D. (2016). Big data exploration requires collaboration between visualization and data infrastructures. In Proceedings of the Workshop on Human-In-the-Loop Data Analytics, HILDA@SIGMOD 2016, San Francisco, CA, USA, June 26 - July 01, 2016 (p. 16). ACM. http://doi.org/10.1145/2939502.2939518
User Experiences with Approximations
- Moritz, D., Fisher, D., Ding, B., & Wang, C. (2017). Trust, but Verify: Optimistic Visualizations of Approximate Queries for Exploring Big Data. In Proceedings of the 2017 CHI Conference on Human Factors in Computing Systems, Denver, CO, USA, May 06-11, 2017. (pp. 2904–2915). ACM. http://doi.org/10.1145/3025453.3025456
- Moritz, D., & Fisher, D. (2017). What Users Don't Expect about Exploratory Data Analysis on Approximate Query Processing Systems. In Proceedings of the 2nd Workshop on Human-In-the-Loop Data Analytics, HILDA@SIGMOD 2017, Chicago, IL, USA, May 14, 2017 (p. 9:1--9:4). ACM. http://doi.org/10.1145/3077257.3077258
- Ferreira, N., Fisher, D., & König, A. C. (2014). Sample-oriented task-driven visualizations: allowing users to make better, more confident decisions. In M. Jones, P. A. Palanque, A. Schmidt, & T. Grossman (Eds.), CHI Conference on Human Factors in Computing Systems, CHI'14, Toronto, ON, Canada - April 26 - May 01, 2014 (pp. 571–580). ACM. http://doi.org/10.1145/2556288.2557131
- Fisher, D., Drucker, S. M., & König, A. C. (2012). Exploratory Visualization Involving Incremental, Approximate Database Queries and Uncertainty. IEEE Computer Graphics and Applications, 32(4), 55–62. http://doi.org/10.1109/MCG.2012.48
- Fisher, D., Popov, I. O., Drucker, S. M., & m. c. schraefel. (2012). Trust me, i'm partially right: incremental visualization lets analysts explore large datasets faster. In J. A. Konstan, E. H. Chi, & K. Höök (Eds.), CHI Conference on Human Factors in Computing Systems, CHI '12, Austin, TX, USA - May 05 - 10, 2012 (pp. 1673–1682). ACM. http://doi.org/10.1145/2207676.2208294